I think the title of the post is misleading.
From the maryland DNR
Are you saying the numbers are BS?
Annual indices of relative abundance provide an early indicator of future adult stock recruitment and document annual variation and long-term trends in abundance and distribution. I don't see anything in this statement that says we're saved.
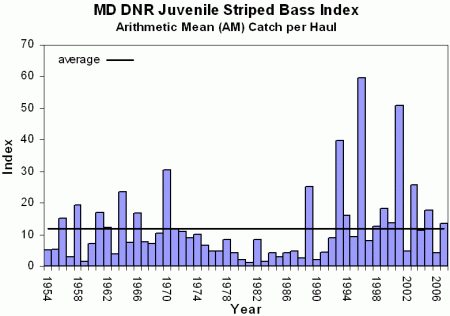
Here's a graph of the annual yoy reports. I'm no marine biologist and i don't pretend to be. It does seem to be a fair indicator of the number of fish in different size classes that I catch form the beach.
What the graph doesn't show is the reason for success or lack thereof. I believe there are things that are just not within our control. Water temps, air temps, rainfall, salinity, water movement, success of forage species, pollution levels etc.
I suppose when everything aligns properly you have a successful yoy. When it doesn't it's a bust. Some of these things are just not within our control, some are. If the stocks are in as bad a shape as the sporties say, how is it that they managed to have great spawning success this year. Why did they not have greater success the year before when there were more big fish. 2002, 2004 2006 were below average recruitment years. Can you explain why?
How many fish are really needed for a successful YOY?
Sure I'd love to see them make it a game fish, my reasons being purely selfish. Right now i think the system is broken, but certainly not irreparable. I don't have the answers.
As far as you closing statements I'm sure there are some recs who will do likewise.


Originally Posted by Shaky


 Reply With Quote